
Yesterday, TrainerRoad officially launched Performance Analytics, the ability to import other rides from third-party apps, and additional features to the “Ride Page”. The idea behind the Performance Analytics was to give users the ability to track and analyze their training progress and compare it to previous seasons and/or performance in an easy to use platform.
“We think that cycling analytics today are overblown, overcomplicated, and bloated for 99.9% of riders out there,” says Nate Pearson, TrainerRoad CEO, “Our goal was to develop an easy-to-use set of tools that show you exactly what you need to become faster while leaving out the rest.”
Here is a walkthrough video of all the new features they added:
Performance Analytics tool encompasses three new features:
- Training Stress Chart
- Personal Records
- Redesigned Ride Page
You can now import all your rides to TrainerRoad. If you have Strava or Garmin connect connected in your profile, TrainerRoad will import all your history. In my case, they imported data going back to 2015 only. The reason for that is Garmin doesn’t have a way to download ride history and I didn’t really get into using Strava consistently until 2015. Either way, three years worth of data gave me plenty to play with and see what this tool is all about.

BULK UPLOAD YOUR RIDES
If you have all your rides files (.fit or .tcx) zipped somewhere on your PC, you can upload the zipped to TrainerRoad from the Past Rides page.
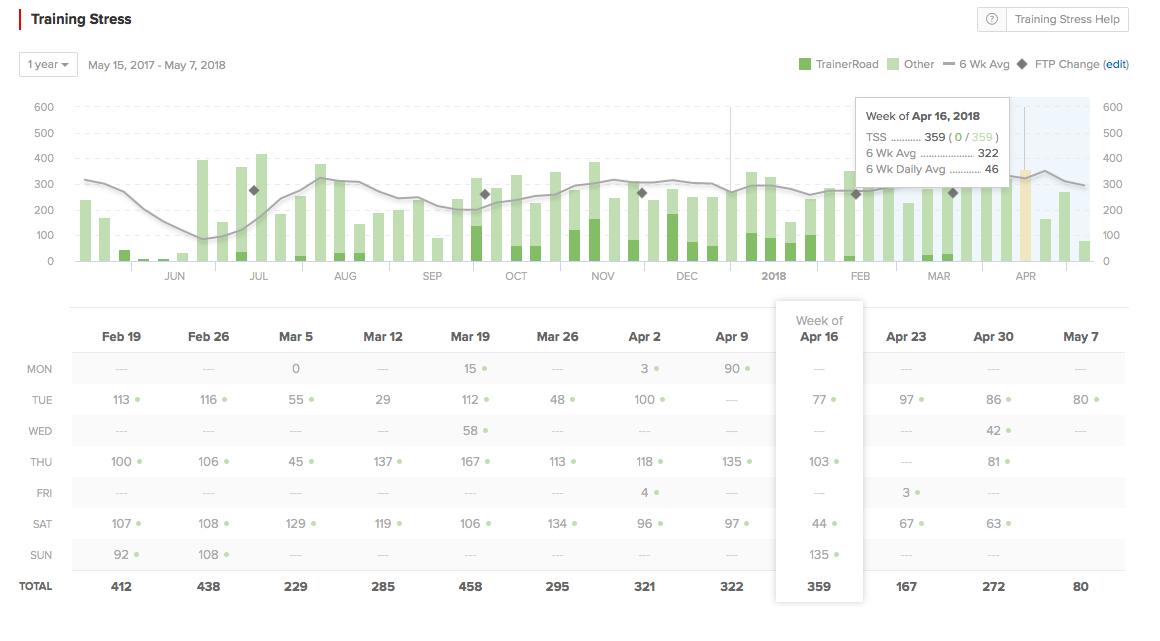
TRAINING STRESS CHART
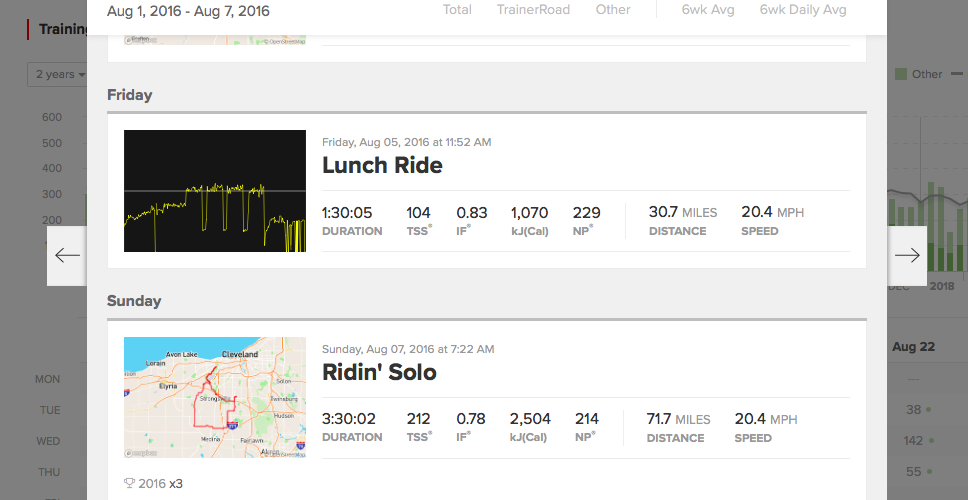
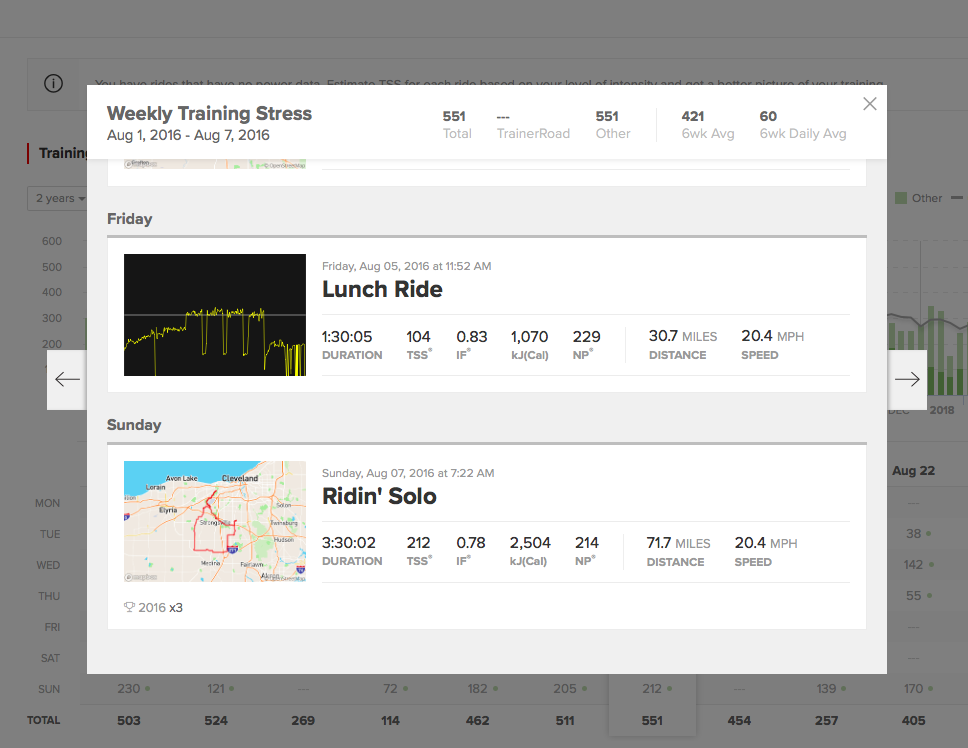
With the ability to import all your rides – whether the ride was done outdoors, with TrainerRoad, Zwift, or just simply a Garmin device – TrainerRoad will import the data and displays it all in one chart. This chart displays a weekly snapshot of your Training Stress Score (TSS) calculated from all your indoor/outdoor rides. You will also see FTP changes throughout the year marked with a gray diamond.
The Training Stress chart can display a maximum of 4 years of Training Stress history.
ONLY FOR CYCLISTS
Currently, TrainerRoad Performance Analytics displays data from your rides only. So if you are a multi-sport athlete, the tool might not be as useful as the other tools currently available that include TSS from other activities as well.
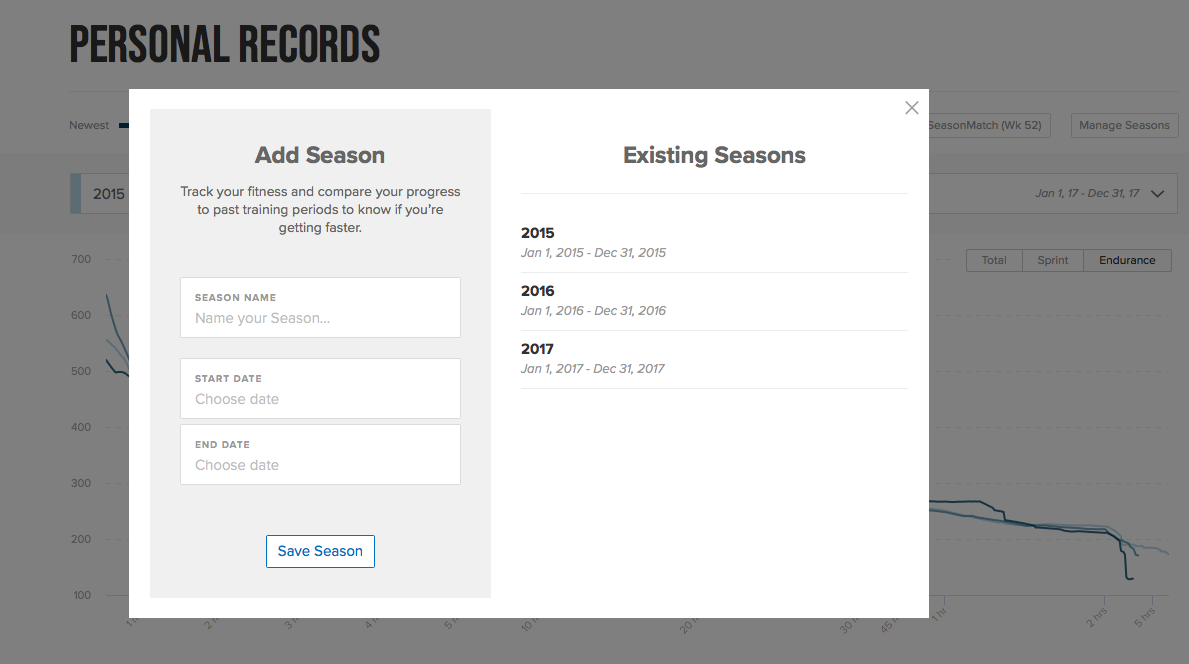
PERSONAL RECORDS AND SEASONS MATCH
The Personal Records section gives you the ability to create different seasons and then compare one season to another. Unlike other tools where they compare seasons by date, the personal record tool shows your records by time.
For example, in the below chart, I wanted to see my best 20-minutes average the past three years. You can just point the mouse over the 20-minutes section and a popup will appear with dates and rides with your best 20-minute average. You can then click on View Details to view all three rides.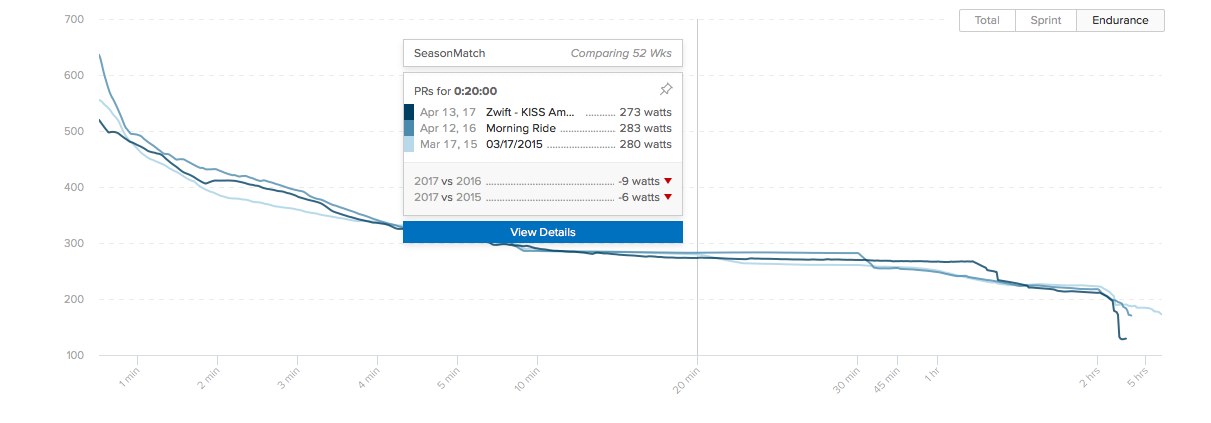
Also, as you get new PRs during the season, you will get a new Personal Record badge and you will see that in your All Rides page. PRs are calculated per second up to 5 minutes then slightly larger buckets after that.
When you turn on SeasonMatch you can compare the same period of time in your current season to the same period of time in a past season.
So for example, if you compare your PRs during the summer triathlon season of 2017, you will see your PRs from the summer of previous seasons.
RIDE DETAIL PAGE
The new ride detail page offers the ability to drill down, zoom-in, create intervals, view your ride on a map, and analyze your ride personal records. I got into more details on that in the video I posted above so make sure you check it out.
EVERYTHING IN ONE PLACE
TrainerRoad wanted to give users the ability to view and drill deeper into their ride data all in one place. Something they did well with the new Performance Analytics tool. Cycling apps usually lack the ability to do too much analytics. Zwift for example only gives a basic summary of your ride. Maybe they know users usually prefer to do deeper analysis using different tools such as Training Peaks, Strava, Xert, or free tools such as GoldenCheetah.
I have always been a fan of using Zwift and TrainerRoad together. I think they offer two different products but complement each other very well in different ways. Maybe now you can analyze your Zwift rides using TrainerRoad Performance Analytics tool.
Thanks for reading!