


The best thing about smart trainers is their ability to measure power produced by the cyclist. If you are new to training with power, this one metric will change the way you train. With a smart trainer or a power meter, your indoor training is more efficient and effective.
Your smart trainer can measure the power produced by you at any given moment and you will see that number displayed on whatever device or application paired with your smart trainer. But there is a lot more to that number than what you see on the screen or your average power.
In this post, I will walk you through what this number means and some of the important metrics used to help you better understand your power meter.
A quick note, some of the metrics we are going to talk about below are trademarked by Peaksware LLC, the parent company of TrainingPeaks. These metrics are Normalized Power (NP), IF and TSS.
Because of Trademark issues and competition between STRAVA and TrainingPeaks, STRAVA created their own calculations and they are named differently.
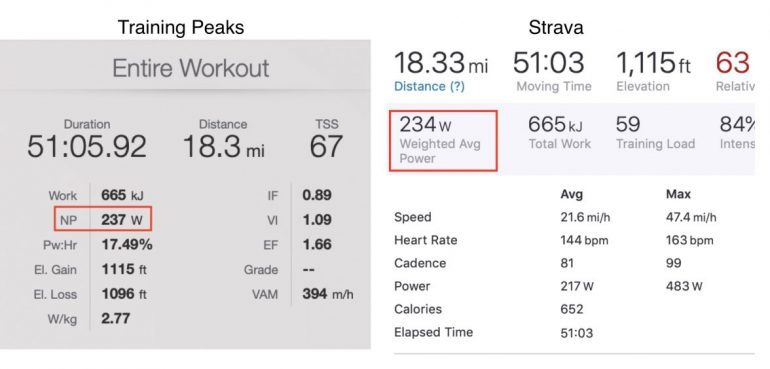
| TrainingPeaks | STRAVA |
| Normalized Power (NP) | Weighted Average |
| Training Stress Score (TSS) | Training Load |
| Intensity Factor (IF) | Intensity |
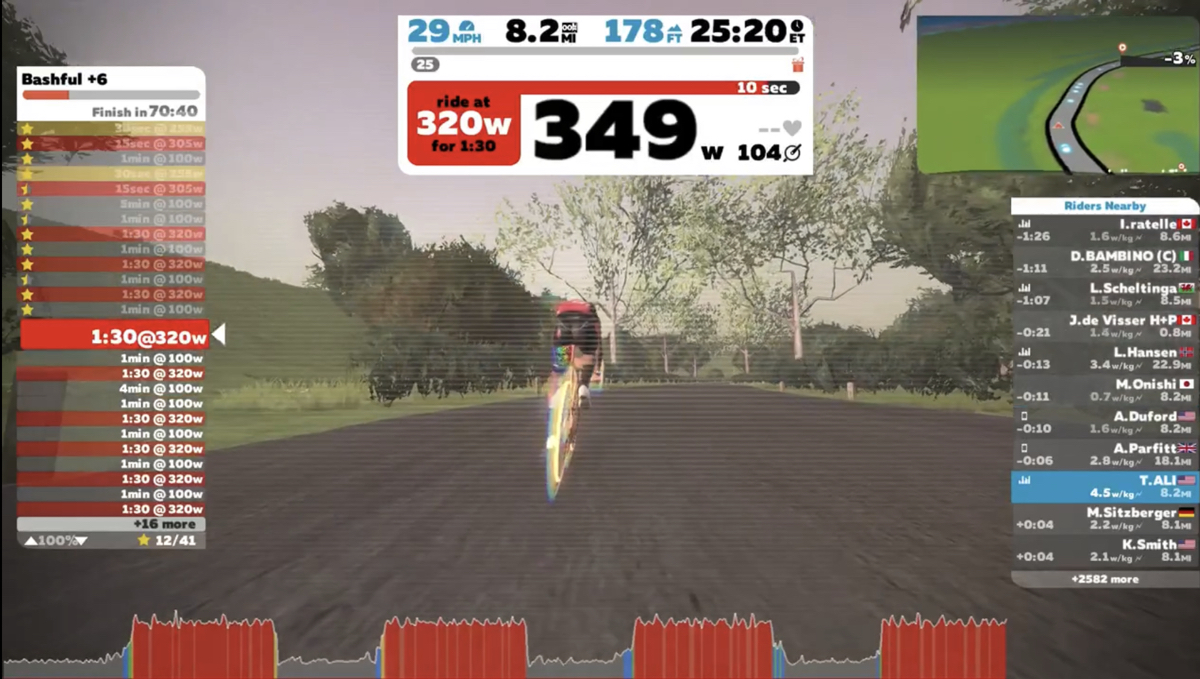
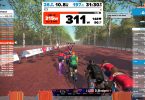
INSTANT POWER /3-sec AVERAGE /10-sec AVERAGE
When you first start training with power, you will notice your power is constantly changing. .This is normal and how it should look like. If you watch the video I posted about power, you will see how my power varies every second.
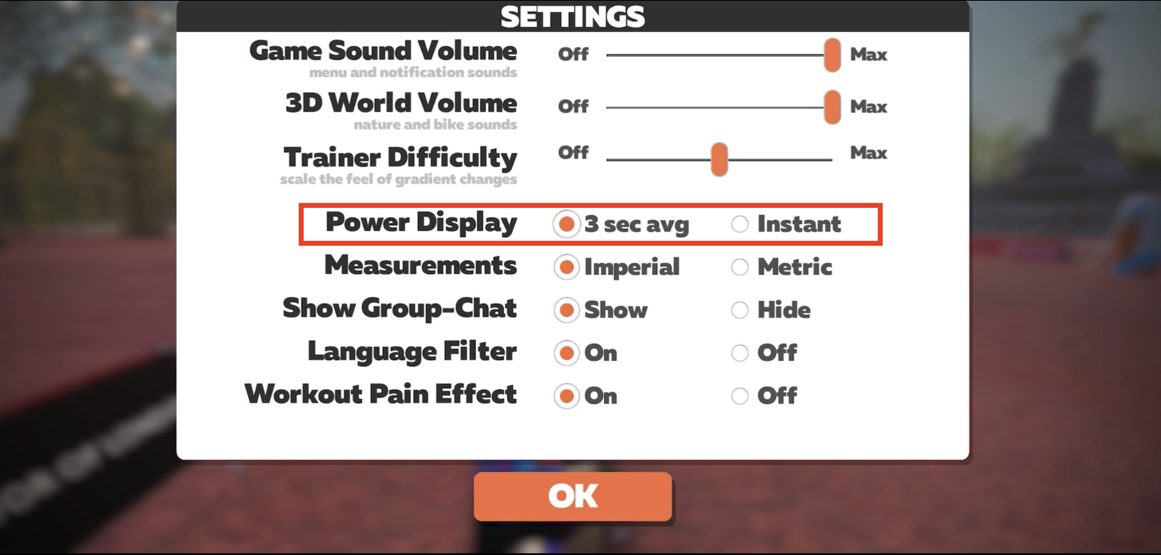
This is because a power meter is measuring the force you are outputting at many different points and reporting this number to your head unit or cycling app. You can smooth this number out by a little bit. In Zwift for example, you can select a 3-sec average. This will average your 3-second power and display a 3-second average. Some head units offer 10 seconds averaging.
Also, different trainers have a different level of fluctuation depending on how they measure power and the size of the flywheel. Some smart bike trainers offer ERG mode power smoothing. The KICKR, for example, has that enabled by default in their app. I encourage you to disable that. When ERG mode power smoothing is enabled, usually the trainer will broadcast your target power instead of your actual power or a highly smoothed number. You can usually disable that within the trainer’s specific app. You can read more about this here.
All in all, I wouldn’t worry about this fluctuation and no matter how much you try, you won’t be able to smooth it out. You aren’t a machine after all.
FUNCTIONAL THRESHOLD POWER (FTP)
Your Functional Threshold Power or FTP is the most commonly used term when training with power. This is the maximum amount of power you can sustain for an hour. One of the first things you need to do when you get your smart trainer is determining your FTP value. Your FTP value is important so you can set your training zones and everything else will make more sense once this value is known.
There are many ways you can determine your FTP. All of which provide a similar estimate. If you’ve been riding with a power meter for a while, you can try to estimate it by crunching all this data into some software such as WKO4, find the best 20-minute effort and multiply that by 0.95. Or let WKO4 estimate your FTP value for you.
Xert takes a different approach to estimate your FTP by analyzing your regular activity data and performing MPA Analysis to estimate your Threshold Power and metrics to define your power profile.
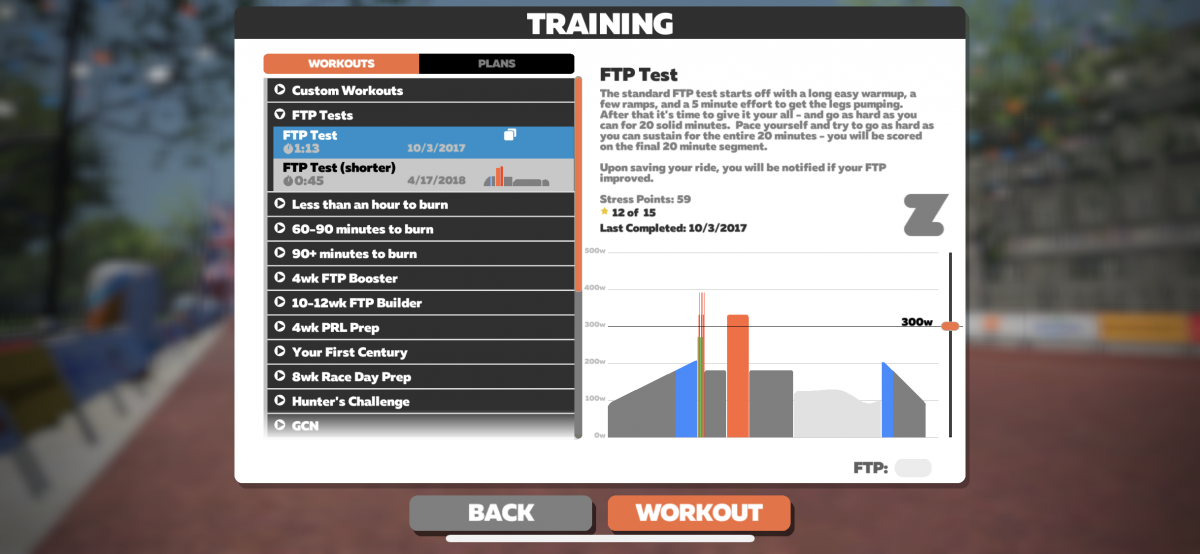
You can also perform an FTP test. This is the common method to estimating Threshold Power. FTP tests come in so many different ways but they essentially all do the same thing. The 20-minute FTP test is the most commonly used test to determine your FTP value. If you use Zwift, you can find the 20-minute test in the workout library and Zwift will guide you through the test with step-by-step instructions.
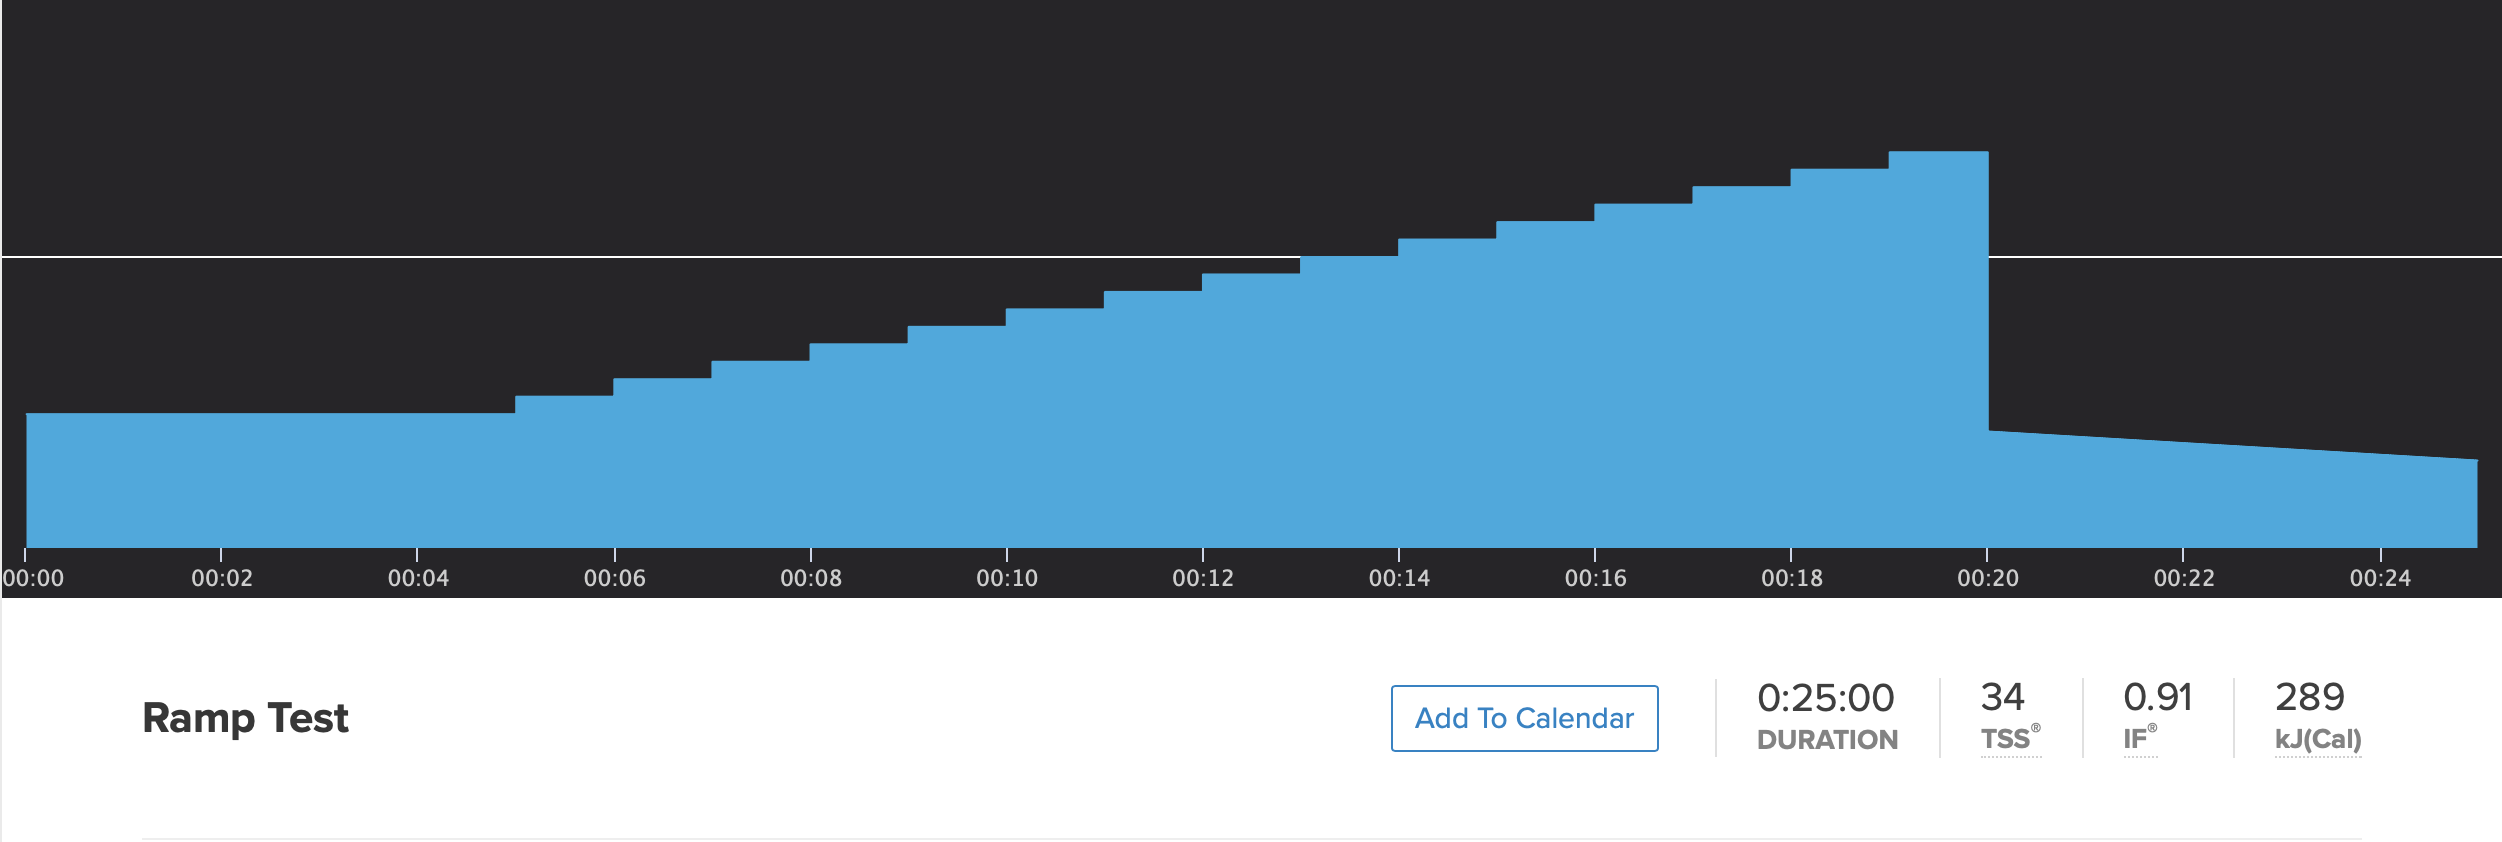
TrainerRoad also has a variety of FTP tests. They have the 20-minute test, 2×8-minutes test and many others. But their latest Ramp test is the one they now use in all their training plans.
SHOULD YOU TURN ERG MODE ON OR OFF DURING FTP TEST?
ERG mode should be turned off when performing any type of FTP test except the Ramp test or instructed otherwise. If you use Zwift or TrainerRoad, they will automatically disable ERG mode for you during the test and you will have to change gear to adjust resistance during the test. This is done because this test is meant to test your current fitness not to see if you can reach some target watt you think you can achieve. (Here is a piece I wrote on how to use ERG mode in Zwift that might help you understand how it works)
TrainerRoad and Zwift will have ERG mode enabled by default for the Ramp test.
SOME TIPS FOR YOUR FIRST FTP TEST
- In any given season, do the same FTP test and follow the same method to get the most accurate and consistent results. For example, if you decide to go with a 20-minute FTP test, then do the same 20-minute test for the rest of your season. If you decide to go with the new TrainerRoad’s Ramp test, do this test for the rest of your season. Also, perform the same warmup everytime you take the test. If you do a 30-minute warmup at 150 watts, then that’s what you want to do for every test.
- Allow time for full recovery prior to performing a test. Usually best to do the test after a recovery week.
- Make sure your smart bike trainer (or power meter) is calibrated correctly.
- Pace yourself. Don’t kill yourself in the first 5-minutes of a 20-minute FTP test. We all made this mistake.
- Be ready to push yourself to the limit. This test should be very hard.
Another way to set your FTP in Zwift is by setting your FTP value very low in your profile and then signup for a race and go ride like you want to win. If Zwift detects a new FTP, you will get a notification to update your FTP.
WATTS PER KILOGRAM (W/KG)
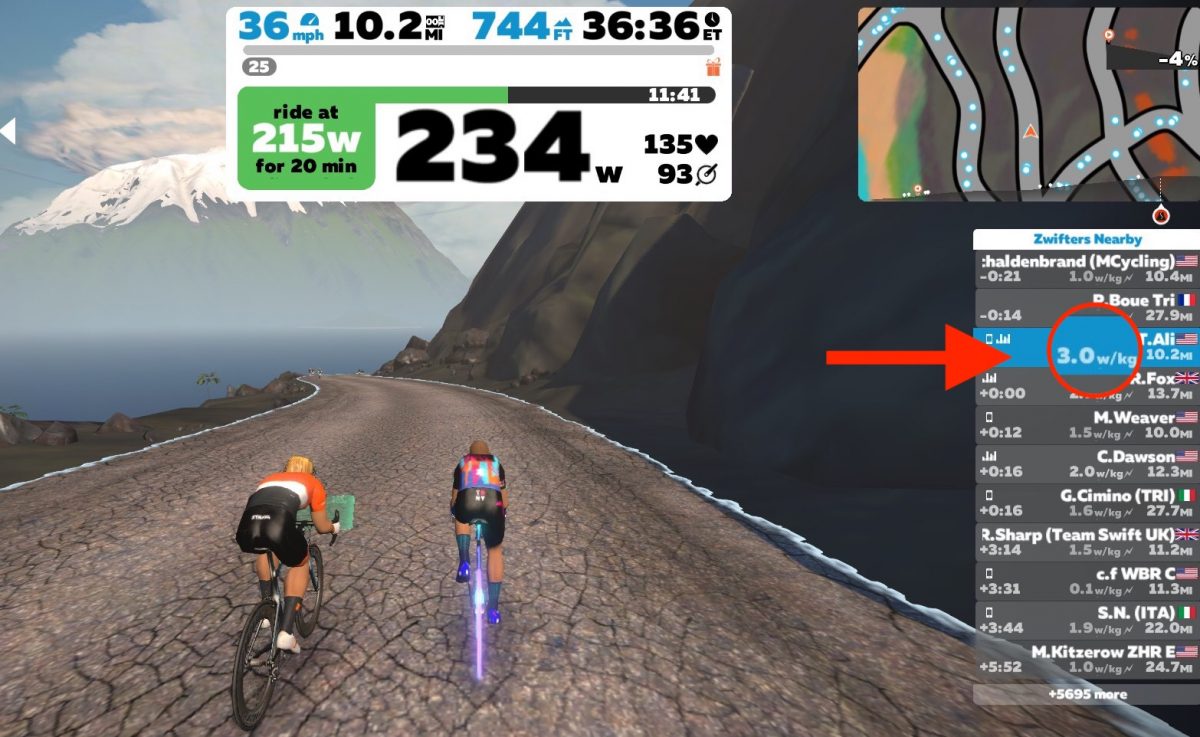
Watts per kilogram is the amount of power you are outputting at any given moment divided by your weights in kilograms. This metric determines the speed of riders assuming all ELEMNTs are the same. This number is also one of the metrics used in Zwift’s algorithm to determine your speed and you will see it next to the riders name in the “Zwifters Nearby” menu on the right side of your screen.
For this number to be accurate, your weight has to be set correctly. In Zwift, make sure you input your weight correctly in your profile.
However, it isn’t always that simple. Watts per kilogram might give an indication of how strong a rider is but doesn’t always determine who is going to be the faster rider. When climbing a hill, your watts per kilogram will always play a big role in how fast you climb and the rider with the higher w/kg will almost always win.
However, on the flats or descents, the absolute power and aerodynamic drag play a bigger role on your speed than your watts per kilogram. For example, on a flat course, the rider with lower w/kg but less aerodynamic drag might be faster than a lighter rider with higher w/kg. So just because your watts per kilogram is higher than someone else, that doesn’t necessarily mean you are going to beat someone with lower watts per kilogram.
AVERAGE POWER
This is your average power and is commonly displayed in most cycling applications toward the end of each ride. Your average power is a similar metric to other averages you’ve seen such as average speed or average heart rate.
Because your power is constantly changing, it’s best to use average power when doing intervals. Average power is useful when doing steady and shorter intervals (20-minutes or less).
Zwift and most other training applications don’t display average power as a metric while riding. It’s usually only displayed toward the end of the ride making it somewhat not very useful. It’s nice to see but it doesn’t give an accurate picture of how easy or hard that ride was. Instead, you will want to use Normalized Power and IF value which we will talk about next.
NORMALIZED POWER (NP)
Normalized Power uses a complicated algorithm to calculate the true effort that went into a ride. Joe Friel described it best in his book, The Power Meter Handbook, as “an expression of average power adjusted for the range of variability during a ride and therefore more closely reflects the effort or metabolic cost of a ride than does average power”
To try to explain this, let’s take a look at a ride I did. The graph you see below was from a workout that had 3 sets of 5×90-second intervals at 125% FTP followed by 30 minutes at 65% of FTP. The average power for the full ride was 175 watts and Normalized Power was 223 watts.
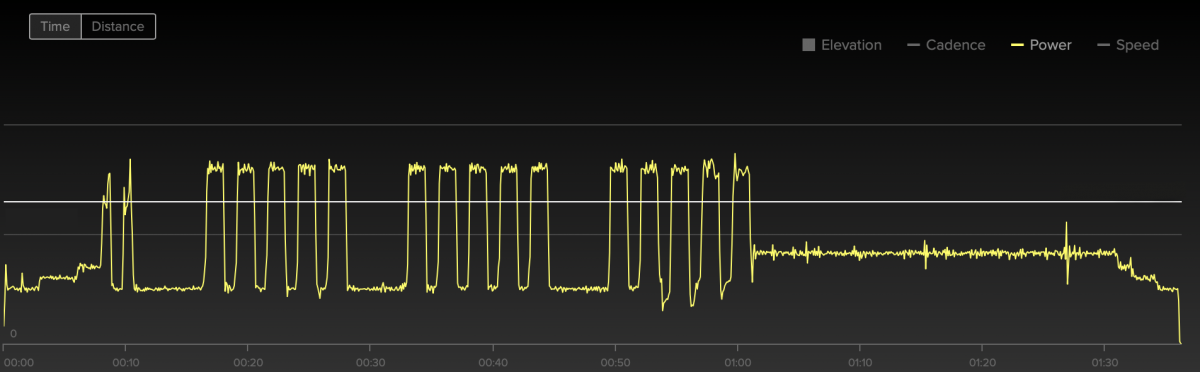
This was a hard workout, however, if I look at the average power only, 175 watts is low Z2 for me. I can ride at 175 watts for hours. As an Ironman athlete, that number is toward the lower end of what I would target during an Ironman race and should leave me with enough to put a decent marathon run.
So basically, if I look at the average power only, for a 90-minute ride, this would be considered an easy endurance ride for me. However, when looking at the NP value of 223 watts, I can immediately tell this ride was not that easy.
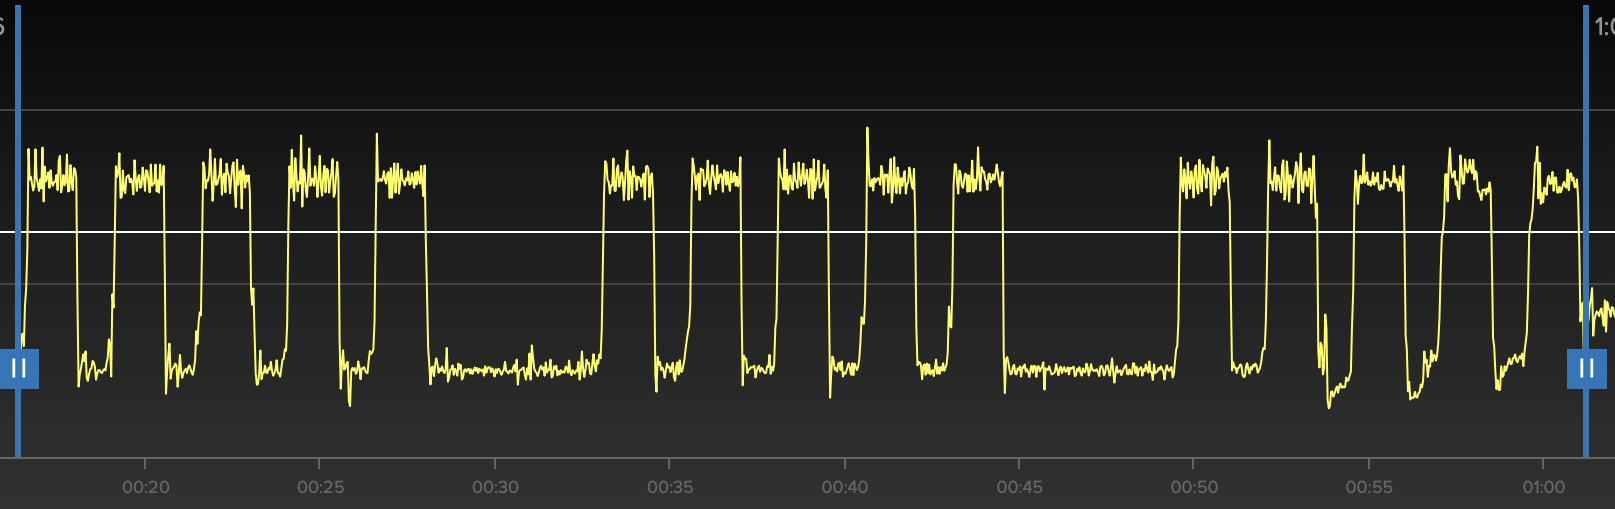
Let’s take a look at the hard section only and eliminate the warmup and cool down. The section you see below was 45 minutes long and the average power was 209 watts and NP was 259. For me, averaging close to 260 watts for 45 minutes is tough. But I’ve done 209 for over 5 hours in training rides without a problem.
HOW TO FIND NORMALIZED POWER
Because Normalized Power was developed and trademarked by Peaksware, the parent company of TrainingPeaks, you can find it in TrainingPeaks and some other companies such as TrainerRoad. You can also find it in Strava but it’s called Weighted Average and uses a slightly different calculation. As of writing this article, Zwift doesn’t display Normalized Power.
You can also display Normalized Power on some bike computers such as Wahoo ELEMNT, Bolt, or Garmin.
INTENSITY FACTOR (IF)
The Intensity factor is simply the ratio of the Normalized Power to your threshold power (NP/FTP). This number is a good indicator of the intensity of the ride. For example, if your FTP is 250 watts and your NP for a 2-hour ride was 200 watts, then your IF for the ride would be 200/250 = 0.80 or 80%.
I like to use this number not just to see how I did in a specific ride or race, but also to know the intensity of a workout before even doing it.
For example, a workout with IF < .75 should be an easy ride. Between .75 to .85 is considered an endurance ride. The higher the IF value the more intense the workout is.
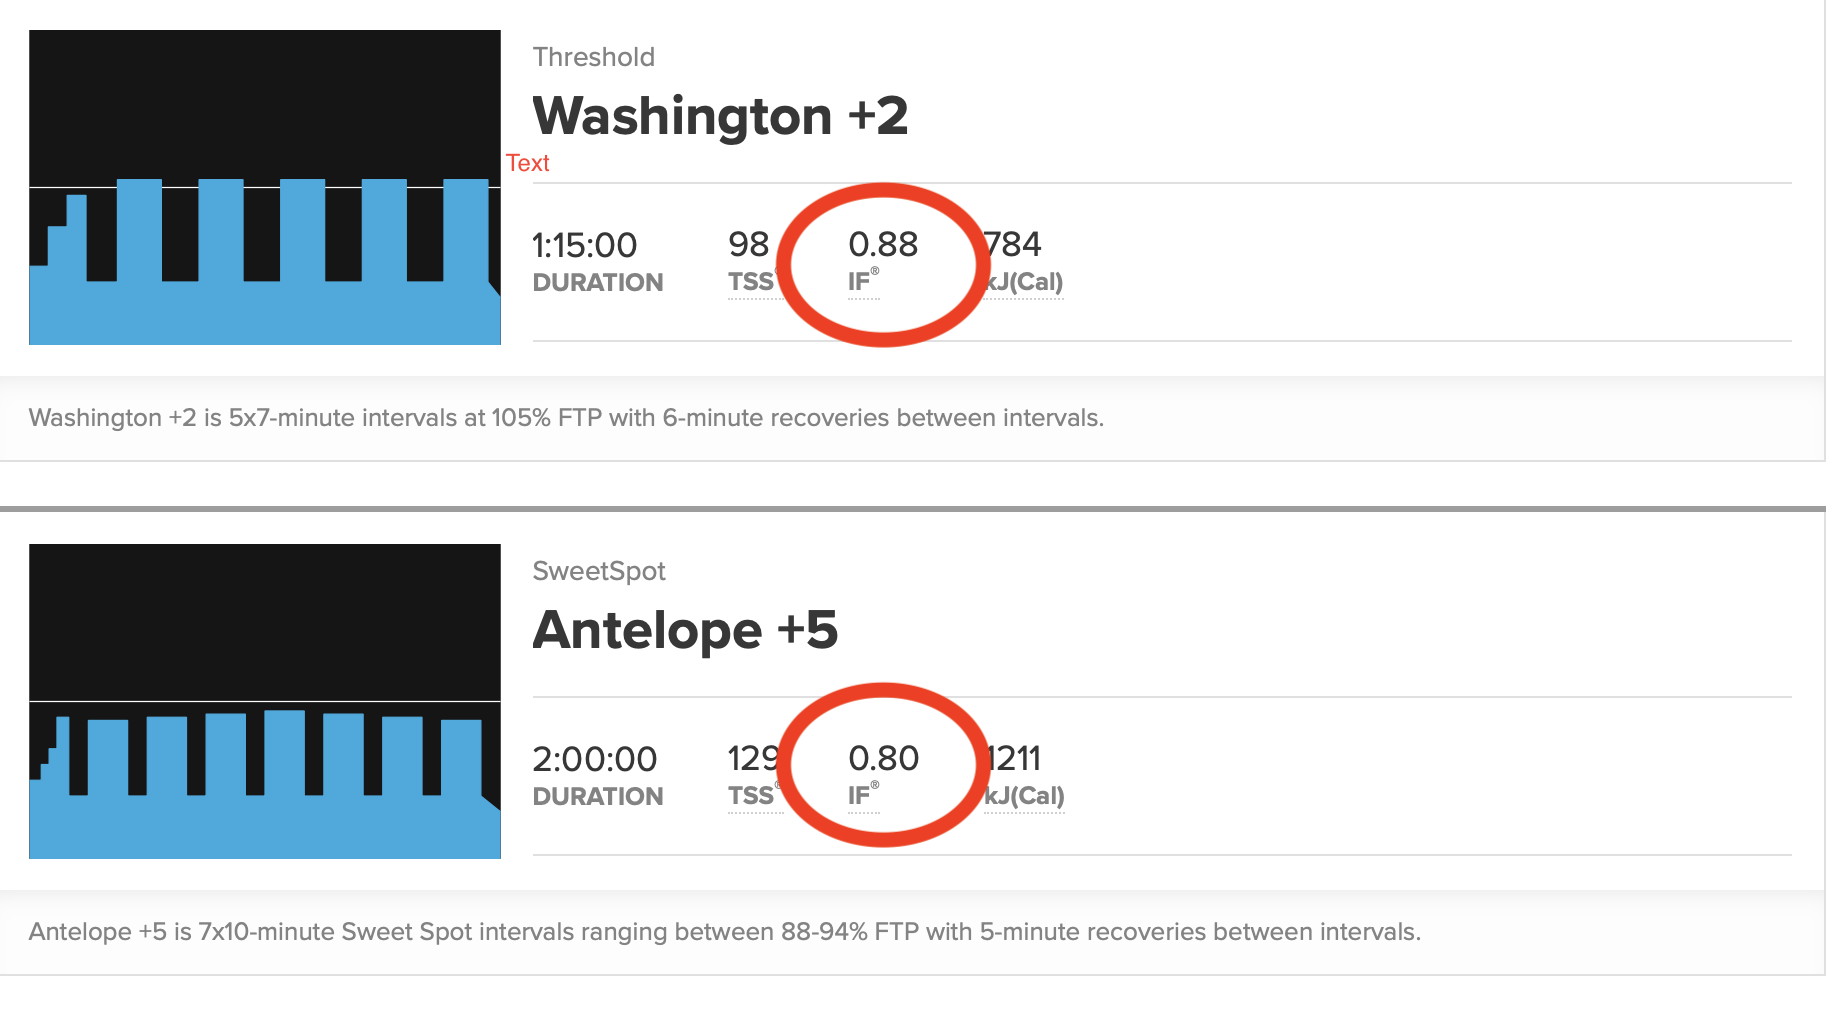
TrainerRoad displays the IF and TSS values next to each workout in their workout library as you see below:
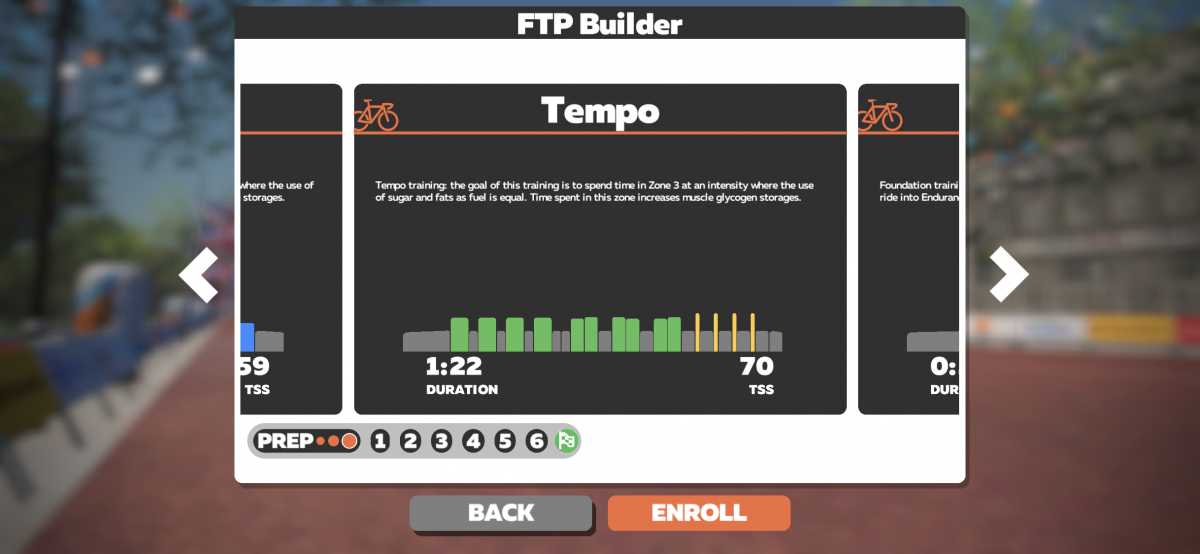
Zwift only displays the TSS value in their workout library:
Another good application for IF is to see if you are within target power in a race. For example, if you are racing an Ironman, generally you want to keep your IF under .75. For a one hour TT event, you might want to target an IF value of 1 to 1.05 or something like that.
TRAINING STRESS SCORE (TSS)
TSS or Training Stress Score is a score indicating the intensity and stress a certain workout produced. It takes into account the intensity and duration of a single workout. TSS is “best viewed as a predictor of the amount of glycogen utilized in each workout” as Dr. Coggan describes in his book, Training and Racing with a Power Meter. The TSS value is also another good predictor of the intensity of a workout so you can look at the TSS value and make a decision if this is a good workout for the day.
The formula to produce the TSS score was developed by Dr. Andrew Coggan and looks something like this:
TSS = (Workout duration in seconds x NP x IF) ÷ (FTP x 3,600) x 100
Fortunately, you don’t have to plug in any of these numbers to calculate TSS. It’s calculated automatically for you in TrainingPeaks, TrainerRoad, Strava, and head units like Wahoo ELEMNT, Bolt, and Garmin.
Also, the cumulative weekly or monthly TSS can be used to calculate your fitness and freshness and it’s a good indicator of how much training or volume an athlete can take that could lead to improvement in his/her fitness before overtraining.
In Zwift, TSS is displayed for each workout in their workout library and is also displayed in the final workout summary screen.
You can also view a version of TSS in STRAVA but it’s called “Training Load” and you will find it in the workout summary screen.
POWER DISTRIBUTION
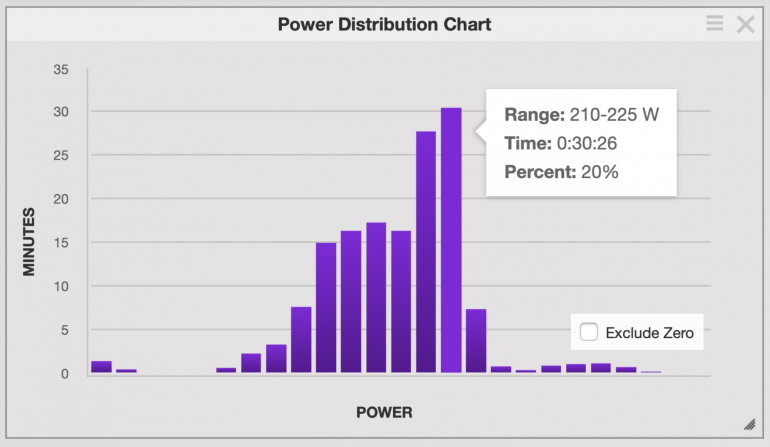
The Power Distribution chart is one of my favorite charts to look at after a workout or race. The chart looks simple but packed with information. The chart gives you an idea of how your time was spent in the saddle. For example, the chart below shows that I spent 30-minutes between 210-225 watts range and around 28-minutes between 195-210. In this specific workout, I was supposed to do 4×20 minutes between 200 and 225 so that time was well spent in that specific zone.
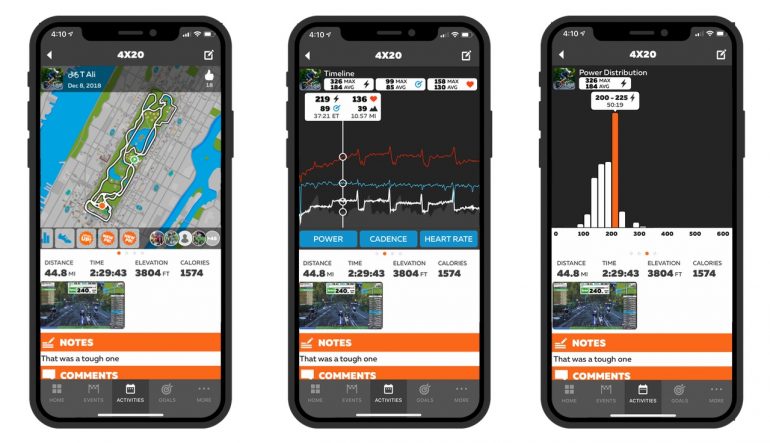
You can also view this chart in Strava and Zwift Companion App under your activities.
With smart trainers and power meters, athletes from all level have the tools to unlock speed and fitness like never before. You just need to understand how to interpret all this data you now have at your disposal. A good coach can guide you through all of this and help you reach your potential. Also, with power from a smart trainer or a power meter, indoor training gains new meaning and more focus since now you have a target to shoot for.
This article was meant to help you understand that there is much more to power than the power number you see on the screen or average power you see displayed after every ride. If you want to dig deeper into training with power, I recommend you read Training and Racing with a Power Meter by Hunter Allen and Andrew Coggan and The Power Meter Handbook by Joe Friel.
Thank you for reading!


Is there a way to calculate the ascending grade, let’s say 5% grade, to a resistance setting on an indoor spinner bike? It would be great if I can match the resistance level on my spinner bike to an ascending grade to better match the same experience of climbing a hill or mountain. I spinner bike is an ICG5 from Life Fitness.
How did you get that Trainer Road workout bashful into Zwift?
I think I manually built the workout in TrainingPeaks and synced to Zwift.