
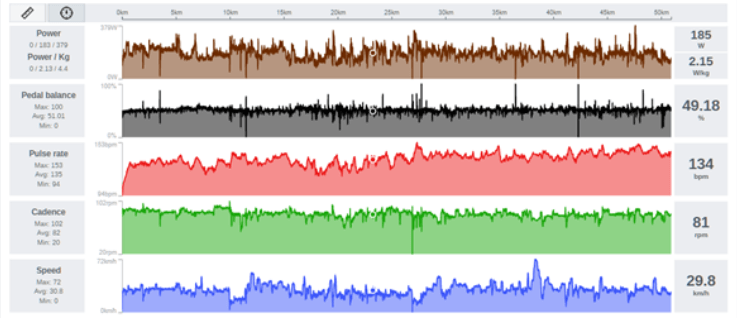
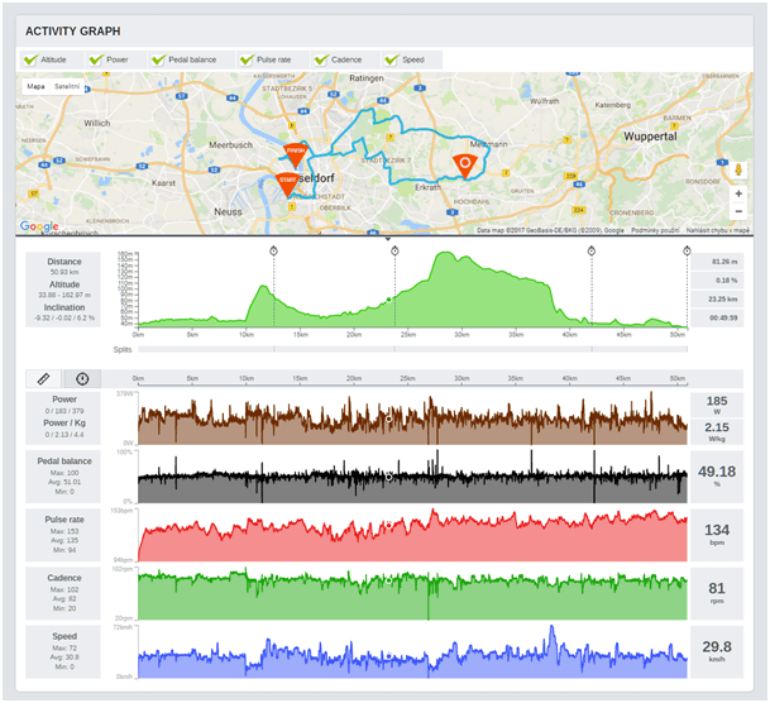
CycleOps rolled out a bunch of updates to its Virtual Training web portal and desktop app. These changes start with the Activity Graph. CycleOps redesigned the activity graph from the ground up back in January and now you can analyze a number of metrics second by second by selecting it on the map or highlighting the section you want to analyze by highlighting the section you want on each metric.
The data shown on the right side of the charts below are automatically recalculated to reflect the data points of a selected section (i.e., Speed at 29.8 km/h in the example below). Data on the left side reflect analytics for the entire graph (ie., Max, Avg, and Min Speed).
Plus, Adobe Flash is not required to view the graphs anymore, which means these key data points are readily available on mobile devices.
If you manually make laps or splits during the ride (both indoor and outdoor), you´ll see these splits in the elevation profile. Statistics for each lap will be calculated automatically so you can compare your rides and check your progress.
VirtualTraining Desktop 4.2.0
There is also a new update to CVT Desktop (4.2.0). The new update has a number of improvements especially in the area of power meter and pedal data.
What´s new?
- Full Support of Advanced Pedal Metrics and Pedal Balance Provided by PowerTap P1 pedals via Bluetooth: Pedal balance is shown for all power meters supporting this functionality.
- Full support of Power Meters: Power meters have higher priority as a source of power over the trainers, pedals have higher priority than Hubs, etc.
- Dynamic List of Trainers: Completely new hierarchy of trainer selection.
- Added sensor type as part of ANT+ scan
- Optimized the Google Street view refresh time
- HR as part of cool down and warm up
- Possible to rate and comment the route immediately once ride finished
- Dynamic list of trainers